
Monday, December 9, 2013
Top 10 Favorite Maps
5 Favorite Student Created Maps
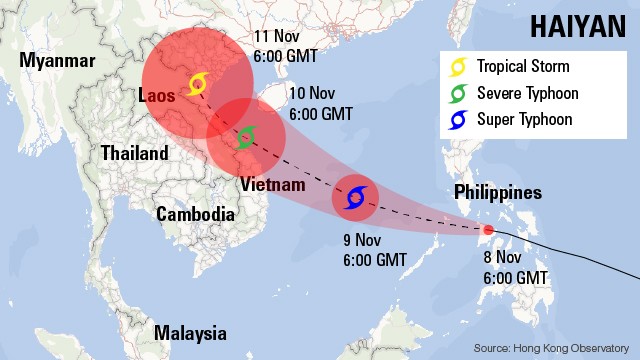
 I really like the colors in this map. It makes me want to see what the map is about (even though its a sad topic).
 I know this isn't the finished map, but I like the iPhone border and the colors she chose to represent the different types of phones. Its a very clean map and I like that.
 This map looks fun to me! I like the way the title is written as well as the border around what the flower represents. Its a cute way to represent plant dealers, but because of the topic, it still looks professional.
 The colors represent "danger" and the font the title is written in also represents that. I think the title is actually scarier than the red colors; it looks like its dripping or maybe smeared on it.
 I liked that this map was about veterans, but its pretty subtle. There aren't soldiers, sailors, etc. all over it. There is just the branch symbols and an American flag background. Its patriotic, and I like how the background is distressed looking.
5 Favorite Weekly Blog Maps

 I think these typographic maps are really cool. DC is my favorite. I actually like this one so much, I'm planning on buying on and framing it to hang up at my house.
 I like the topic of this map and well as how its layed out. It has a satellite image as a background as well as colors that remind me of fantasy/sci-fi. I think it really represents the topic.
 This map has an interesting project. Its kind of hard to follow if you weren't familiar with the area you wre looking at, but its interesting to see the connection between mining and poverty rates.
 Another typographic map. I like how simplistic this one is. Like the other typographic map I liked, I also like this one so much, I'd like to buy one. I just googled it and there's a water color version I really want now! I didn't realized I liked fonts so much until this class.


5 Favorite Weekly Blog Maps

I like the subject of this map. Most of the world seems to use Facebook and I'd never heard of most of the other social networks. I think its kinda funny how the Phillipines uses Friendster. that social network was popular in the US before Myspace.


Monday, November 18, 2013
.jpg)
Saturday, November 16, 2013


Wednesday, November 6, 2013
Final Project Proposal: Virginia Lighthouses
I am going to do my final project on the location of
lighthouses in Virginia. I will also add details of the lighthouses that the
map audience would find interesting (i.e.- I will point out which lighthouse is
the oldest).
I chose this topic
because I grew up near multiple lighthouses from Maine all the way down to
Florida. I remember lying in bed watching the light from the Assateague
Lighthouse through my window. I believe the audience for this map would most
likely be tourists, although it could also be used a general map. There is not
going to be enough information on the map for it to be used for navigation
purposes. The data for when the lighthouses are running and how far the lights
can be seen is available, but is not meant for this type of map.
The map would be a thematic map. Each lighthouse would be a
specific point, and each point will be represented by a small lighthouse. The
scope of the map would be the state of Virginia, specifically the eastern half.
Most of the lighthouses are located in the southern eastern part of the state,
although a few are located on the north western side/eastern shore. The base
map would be of the state of Virginia, also focusing on the eastern half of the
state. The data is from the United States Coast Guard 2013 Volume II Atlantic
Coast Light List (found at this link). The list and data is updated weekly or
as needed and it is very accurate. It includes a list of “lights, sound signals,
buoys, daybeacons, and other aids to navigation”. It also includes the
coordinates to the exact location of each lighthouse, buoy, etc.
The main challenge with the map will be to put every lighthouse on the map without it looking crowded or sloppy. If a vector image is not available, another challenge might be to make a lighthouse image.
The main challenge with the map will be to put every lighthouse on the map without it looking crowded or sloppy. If a vector image is not available, another challenge might be to make a lighthouse image.
The steps to making most of the map will not be too hard. After
finding a good basemap of Virginia, I will either use a vector image of a
lighthouse or make an image of the lighthouse. Then, I’ll use the coordinates
to place the lighthouses at their correct locations. If space is available or
when the information might be important, I will include it next the
lighthouses. Finally, the most tedious part is to add the small details to the
map that make it look professional. The colors and what data are on the map
will be important, because without it, much of the map will look empty.
Sunday, November 3, 2013

Saturday, November 2, 2013
Dot Density Map of Australia

Monday, October 28, 2013
Isoline Map of Smerg


Sunday, October 27, 2013
Isoline (or Isarithm) Map

Monday, October 21, 2013

Wednesday, October 16, 2013
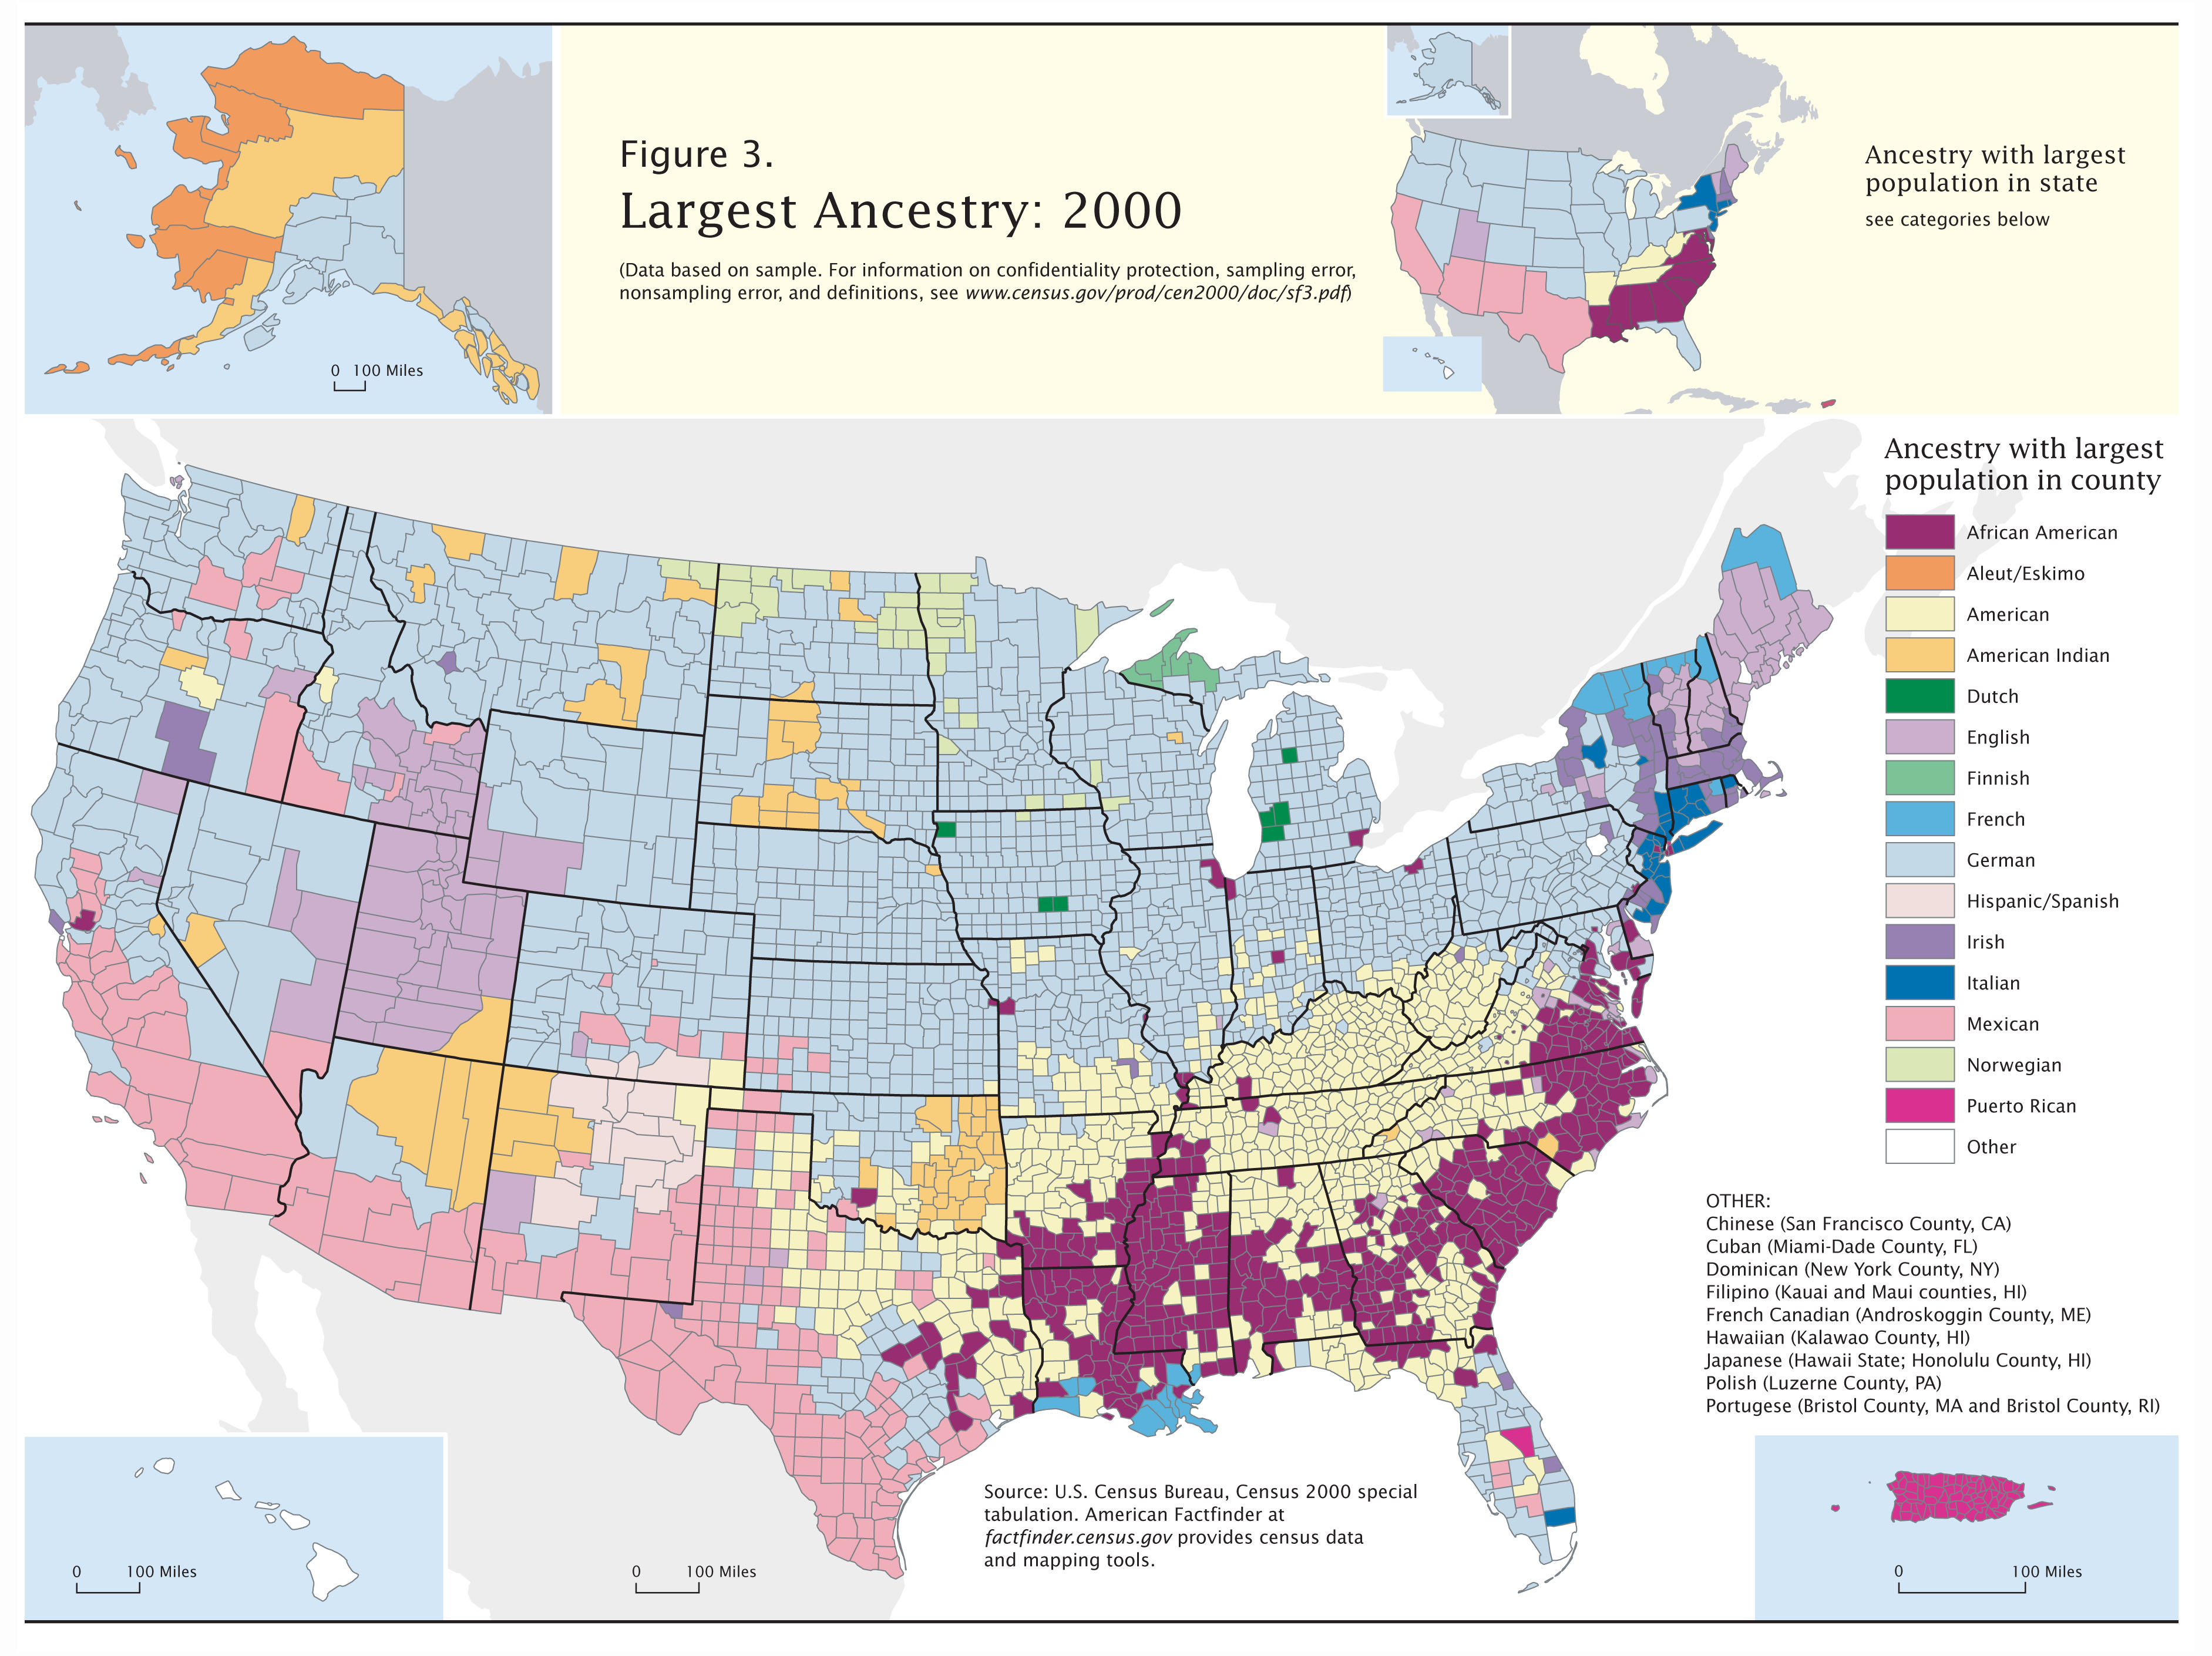
Colored Map of the Distribution of Asian Americans

There is a noticeable difference between how the map looks on a computer screen and how the printed version looks. The one on my screen appears to be darker and appears a little dull. The gradient background appears to be darker. If I could make changed, I would make the 14.9% class a little more pink.
Sunday, October 13, 2013
Geography of Skin Color

Thursday, October 3, 2013
Sunday, September 29, 2013

Sunday, September 22, 2013

Thursday, September 12, 2013

Thursday, September 5, 2013

Thursday, August 29, 2013
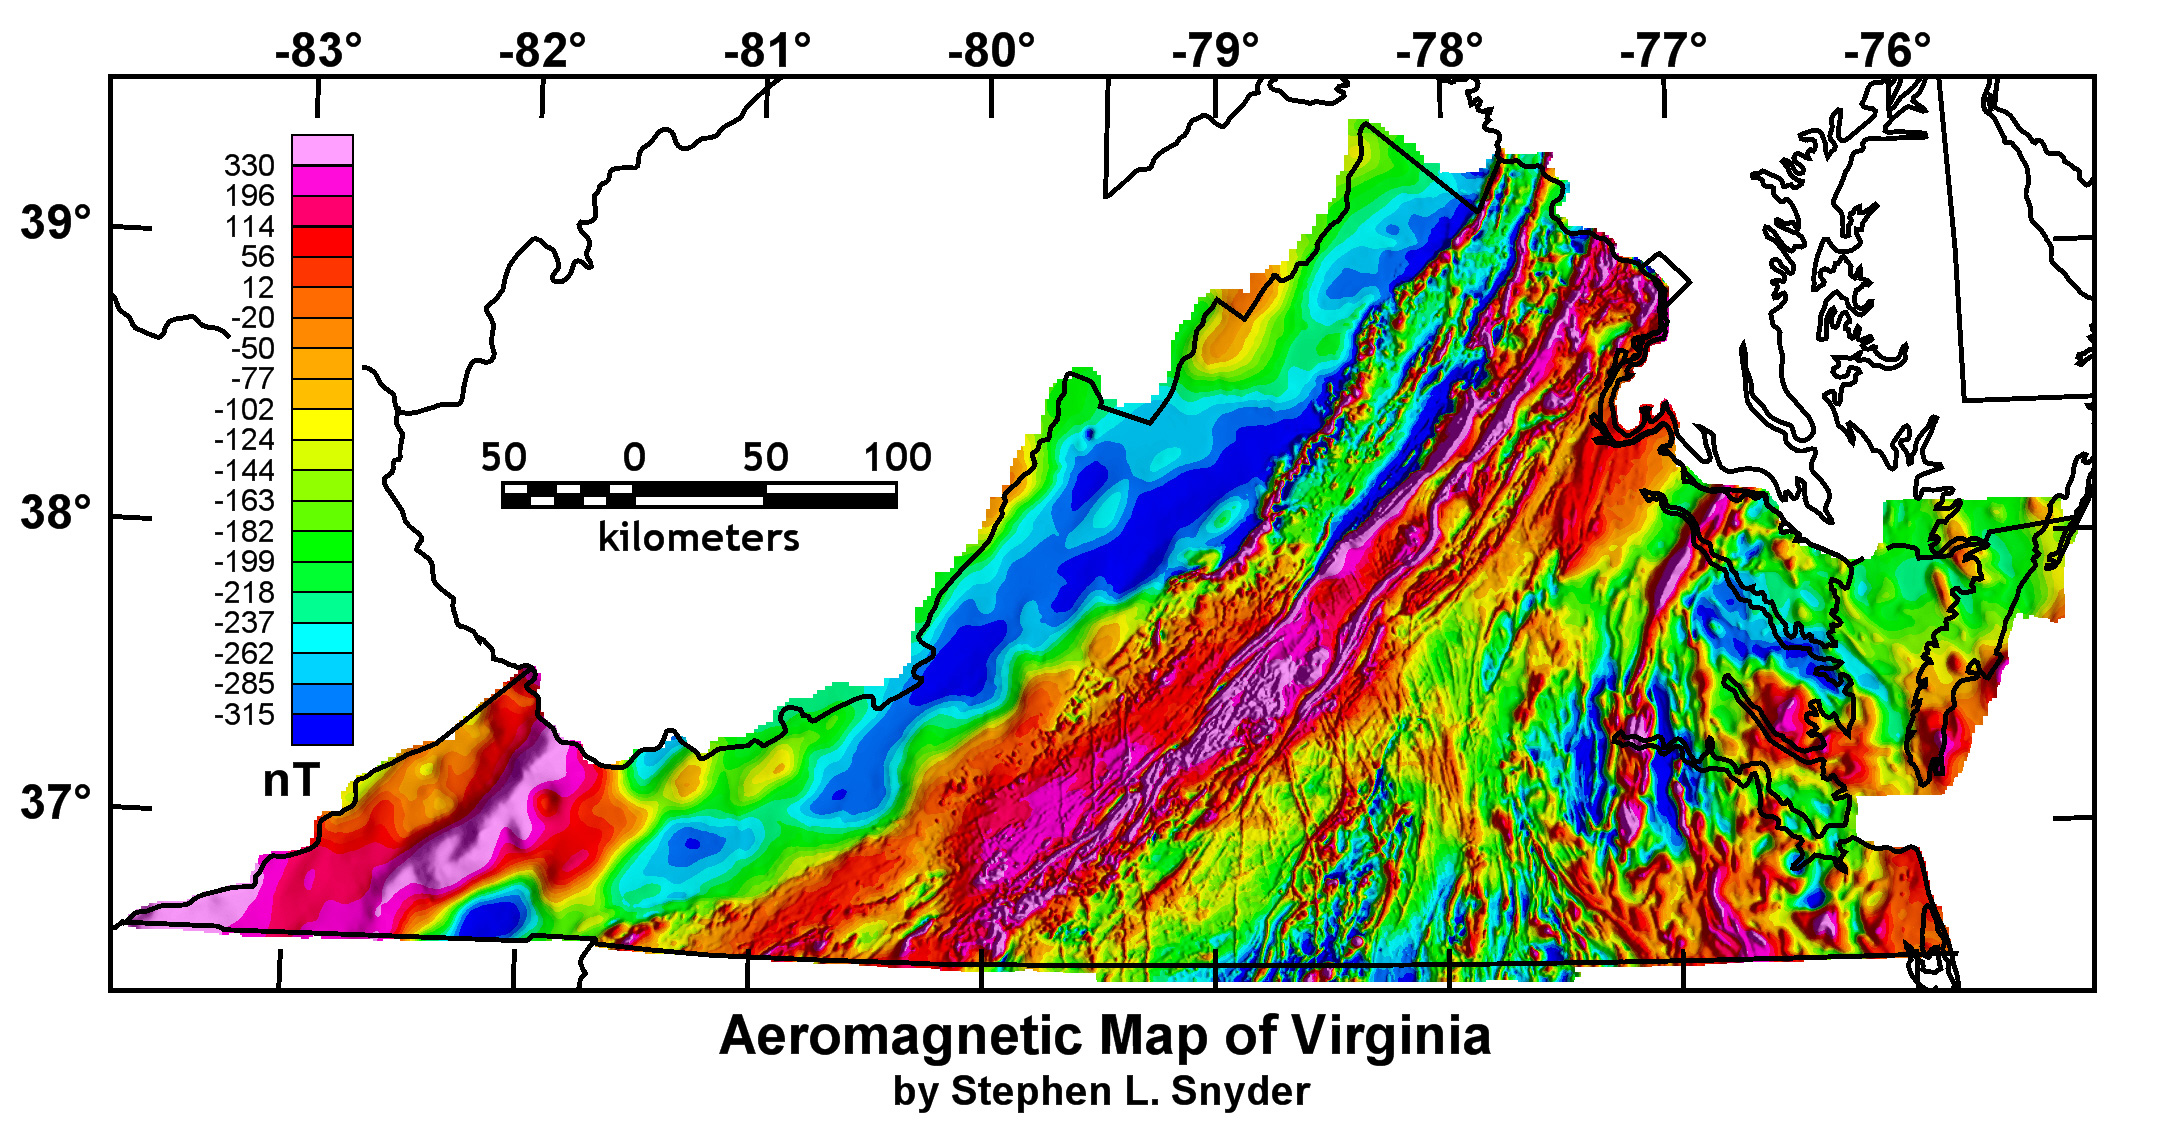
Most maps are of Earth, not the air/forces above it. This one maps the intensity of the Earth's magnetic field and gravity levels throughout Virginia.
Subscribe to:
Posts (Atom)